Onpoint Launches Latest Release of Business Intelligence Solution
August 2020 – With the need for accessible and actionable data becoming more important than ever, Onpoint recently released an update to our Business Intelligence (BI) reporting solution, which leverages the latest technologies and remains focused on our clients’ priorities, including ease of use, rich content, and reliable performance to support meaningful data analysis.
Onpoint’s latest release was developed in collaboration with our clients, including key input from Vermont and Washington users, to ensure that we continue to meet their broad range of information needs – from population health and provider quality to value-based purchasing. Onpoint’s BI solution aims to eliminate many of the common barriers to conducting data analysis by empowering technical and non-technical users alike with analysis-ready data sets, easy-to-understand documentation, and intuitive dashboards that allow users to uncover their own insights into the data.
Our analytic-ready data sets are organized as data marts that focus on reporting measures and metadata at specific levels of aggregation. The member data mart, for example, contains a variety of information and measures that can be attributed to a specific member, including chronic condition flags, HEDIS quality measures, risk scores, and attributed provider. Additional data marts address submitter-related information needs, which allow users to report ongoing trends in data submissions and availability; episodes of care reporting, which provides data on common procedures and the facilities that provide them; as well as provider and geography, which further aggregate member-level measures.
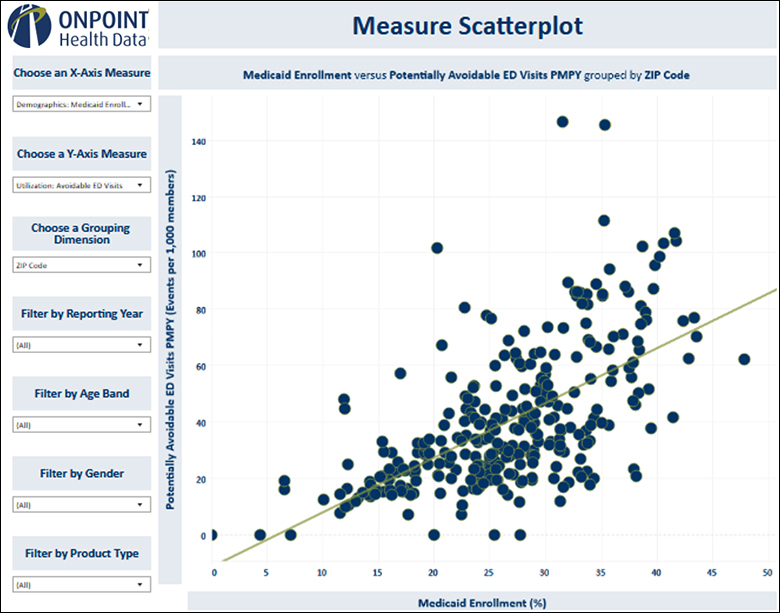
These data marts feed a series of topic-specific dashboards for easy, intuitive analysis of the available data. The dashboards, built in Tableau and provisioned within a private Tableau Server for each client, allow users to examine, manipulate, and present all of the data available within the data marts. Dashboard users are able to trend metrics across reporting periods, isolate specific populations of interest, examine the impacts of geography and chronic conditions on outcomes, and compare multiple metrics against each other to determine the types of relationships that exist between them (see Figure 1 below).
Onpoint partners with our clients to understand their reporting needs, which guide the ongoing releases and updates to our BI solution. The solution’s intuitive architecture, flexibility, and dynamic visualizations distinguish our BI reporting from legacy solutions on the market and allow clients to make their data more accessible through a highly cost-effective product. Onpoint’s team additionally ensures that our clients are supported throughout implementation, providing detailed documentation, hosting training sessions, and providing responsive technical support for all users.
Figure 1. Example Reporting of Medicaid Enrollment & Avoidable Emergency Department Visits