Onpoint Releases New Reporting to Support Clients’ COVID-19 Analyses
December 2020 – Over the past weeks, the number of new COVID-19 infections and deaths has risen to record highs in the United States. Information about the development and spread of the coronavirus continues to be critical for planning efforts at every level of healthcare administration – from federal strategies about upcoming vaccine distributions to provider-level decisions about how best to use telehealth to manage care for high-risk patients. Additionally, data that describe the impact of the virus on healthcare service delivery since last March, when most statewide lockdowns began, reveal changes to the healthcare landscape that may be here to stay. To help our clients understand how their state or region is being impacted, Onpoint has developed a series of reports that illustrate recent trends in insurance claims data as they navigate an uncertain future.
Onpoint’s COVID-related reporting, which is included with every data set delivery, features three primary report sections, each with a specific purpose. The first section compares trends in eligibility and claim volumes in 2020 to those same trends in 2019. This allows data users to identify the overall trend for a given category of claims in 2020, see if the trend undergoes any notable shifts with the spread of COVID, and assess the magnitude of any shift relative to the same time period in the previous year. The reports display overarching trends in medical and pharmacy utilization and coverage as well as trends in a specific set of claim categories that are COVID-related and/or expected to change due to the pandemic. These areas include COVID-19 testing claims, claims with a COVID-19 diagnosis, telehealth services, office visits, emergency department services, and inpatient stays. Additionally, these trends are displayed both overall and by major product type (i.e., commercial, Medicaid, Medicare).
The second report section employs a dynamic pivot chart that allows analysts to drill into trends for each claim category, evaluate trends in multiple measures, and adjust the date range for their analysis. The third section offers a detailed description of coding guidelines that enables end users to dive into the data tables themselves with all of the necessary tools for identifying claims of interest.
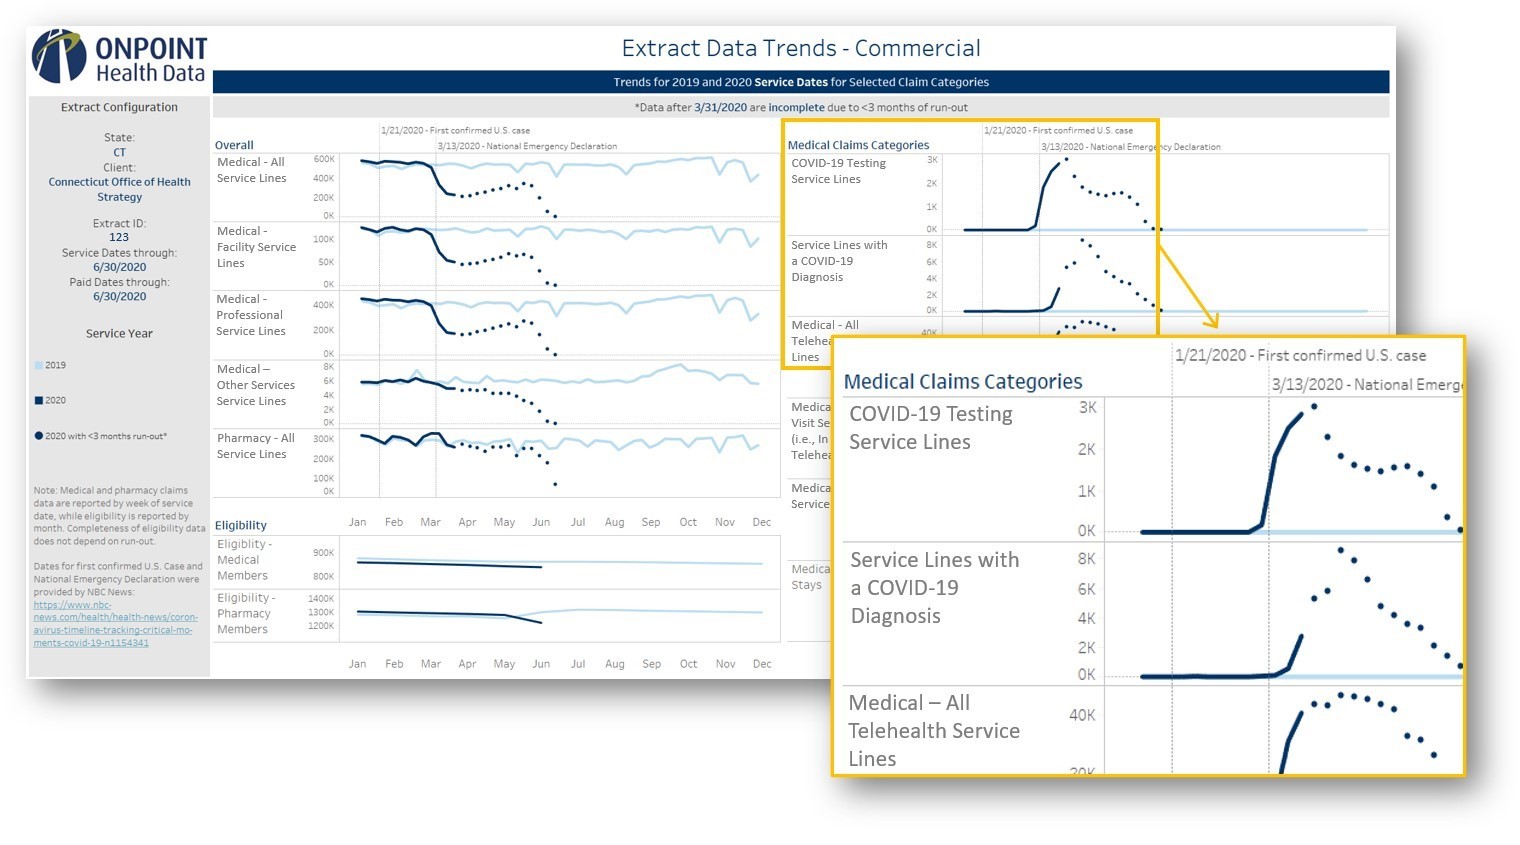
An example of the first report section that was delivered to the Connecticut Office of Health Strategy, analyzing trends in the state’s commercial APCD data, is included below. When interpreting these trends, it is important to note that data are considered complete only through the end of March 2020 based on data received for Connecticut’s APCD; all data points in April 2020 and beyond (represented by dots) are considered “incomplete” since they have fewer than three months of paid run-out and therefore are likely subject to adjudications that will continue to arrive.
This reporting identified a 53% decrease overall in reported medical claims between the first and third weeks of March 2020 (i.e., when the lockdowns began). This drop was seen in both facility (50% decrease) and professional (54%) claims as well as in office visits (50%). Despite their typically unplanned and acute nature, emergency department services (37%) and inpatient stays (33%) also decreased significantly. Conversely, there was no noticeable dip in pharmacy claims. In fact, pharmacy claim volumes were 7% – 13% higher in each of the first three weeks in March 2020 compared to the corresponding weeks in 2019. This is likely due in part to an announcement on March 10 by Connecticut Governor Ned Lamont that insurers were encouraged to allow early prescription refills and extend prescriptions from 30 to 90 days when appropriate, in anticipation of the state’s partial lockdown that began on March 23. Accordingly, Connecticut residents appear to have filled many of their prescriptions proactively. As expected, COVID testing, claims with a COVID diagnosis, and telehealth claims increased dramatically in the second and third weeks of March. There was no notable change in eligibility over the first half of 2020.
There is still much to learn about COVID-19, and answers to key questions about its course and impact will be at the center of healthcare analytics for the foreseeable future. The reports that Onpoint is providing to our clients, along with the findings that they can be used to generate, represent the latest step in helping clients use their APCDs to understand the COVID-19 pandemic and plan how to respond most effectively.
Figure: Early COVID-Related Trends in Commercial Data from the Connecticut APCD (January 2019 through March 2020)