Clients Leveraging APCDs for COVID-19 Analytics
May 2020 – Onpoint's analysts have been working with state governments and other clients to generate baseline data to support state and regional resource planning and modeling efforts in response to COVID-19. Our initial analyses have focused on determining the number and prevalence of patients who have respiratory and cardiovascular conditions, cancers, and other health conditions that may make these patients more susceptible to hospitalization from COVID-19.
Our analytics team leveraged claims data available in all-payer claims databases (APCDs) to identify the patients with COVID-19-susceptible illnesses. We then identified all patients with cancers, diabetes, serious respiratory conditions, cardiovascular conditions, etc. – the types of conditions known to increase risk of hospitalization and other severe illnesses related to COVID-19. The analytic data sets and dynamic BI solutions have allowed clients and their stakeholders to modify definitions of the at-risk population and adjust as more information becomes available about COVID-19’s impact. Clients can, for example, decide to include or exclude various conditions in their identification of at-risk patients. They also can include an age cut-off in their definition and explore the data by major payer (i.e., commercial, Medicaid, Medicare) to understand the impact differences by type of insurance.
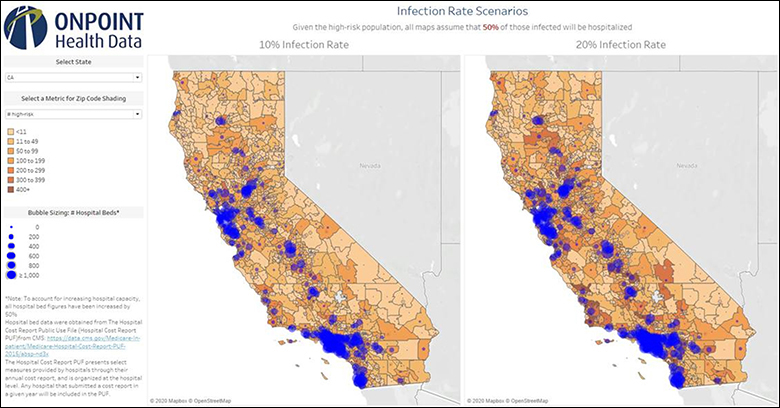
After identifying the at-risk patients, prevalence and counts of these patients are mapped and reported by county, town, ZIP code, and other geographical areas to help identify locations where many patients might be severely impacted should an outbreak occur. Additionally, we have incorporated hospital-bed capacity data by region to help officials more effectively plan their responses from a health-system capacity perspective.
As COVID-19 claims begin to be processed and reported by payers to APCDs, we will pair this baseline data on the prevalence of chronic health conditions by region with data identifying COVID-19-related tests, diagnoses, hospitalizations, and other outcomes such as ventilator use. This data will allow policymakers and researchers to evaluate the direct impact of COVID-19 as well as monitor local and state responses.
Figure 1. Infection Rate Scenarios Calculated for California